

More traffic isn't automatically better website performance. A financial advisory firm can attract a large audience and still generate little business value if visitors aren't qualified, the conversion path isn't clear, or regulated onboarding creates friction. A smaller flow of relevant prospects who complete an appropriate inquiry can be more useful than a traffic spike that produces no actionable pipeline.
That changes how financial professionals should approach KPIs for websites. The right dashboard connects acquisition, engagement, conversion, technical performance, and compliance outcomes. It distinguishes between someone who reads an educational article, someone who requests a consultation, and someone who completes the information required for a compliant next step.
Table of Contents
- Why Most Website KPI Dashboards Fail Financial Advisors
- The Core KPI Categories Every Advisory Website Needs
- Engagement and Conversion Metrics That Actually Matter
- Technical Performance KPIs and Core Web Vitals
- Device-Specific Benchmarks for Financial Services
- Building Your KPI Dashboard and Reporting Cadence
- The Compliance-Aware KPI Framework for Regulated Firms
Why Most Website KPI Dashboards Fail Financial Advisors
Many advisory dashboards still mistake visitor volume for growth. That shortcut fails when a firm serves a defined client profile, prospects need time to evaluate credibility, and conversion requires compliant disclosures or intake steps. A traffic increase can reflect stronger visibility without producing a single suitable inquiry.
The deeper problem is poor interpretation. A high bounce rate may indicate that a visitor found a direct answer, or that a service page was unclear, slow, or missing the information needed for the next step. In Google Analytics 4, an unengaged session is one that does not meet its engagement conditions. For an advisory firm, the useful question is whether the definition fits the page purpose. A brief disclosure-page visit may be acceptable, while an exit from a consultation page before a clear inquiry option deserves investigation. The metric needs page-level and compliance context, not a universal pass-fail threshold.

Vanity metrics versus operating metrics
Page views, unique visitors, and sessions still have practical uses. They show whether content is being found and whether demand is changing. Their value ends when they appear as the final result instead of inputs to a business decision.
A better report connects conversion rate, page views, average session duration, and unique visitors with source quality, service interest, inquiry status, and onboarding progress. A page with fewer visits may outperform a popular educational article if its visitors are more likely to fit the firm's services and complete an appropriate next step.
The useful question is not, “How many people arrived?” It is, “Which sources brought suitable prospects, what did those prospects review, and how many advanced without creating a compliance problem?” Track the path from source to landing page, relevant service content, inquiry, qualification, and regulated intake.
Practical rule: Keep a metric on the main dashboard only when a partner, marketer, or compliance reviewer can use it to make a decision.
Advisory firms also need a different success model from businesses with short purchase paths. A prospective client may read educational content, return several times, review disclosures, request a conversation, and then complete a regulated intake process. Teams that build a KPI dashboard around those stages will produce more useful reporting than teams that collect every available analytics field. The dashboard should show where qualified prospects progress, where they abandon the process, and which measurements deserve action.
The Core KPI Categories Every Advisory Website Needs
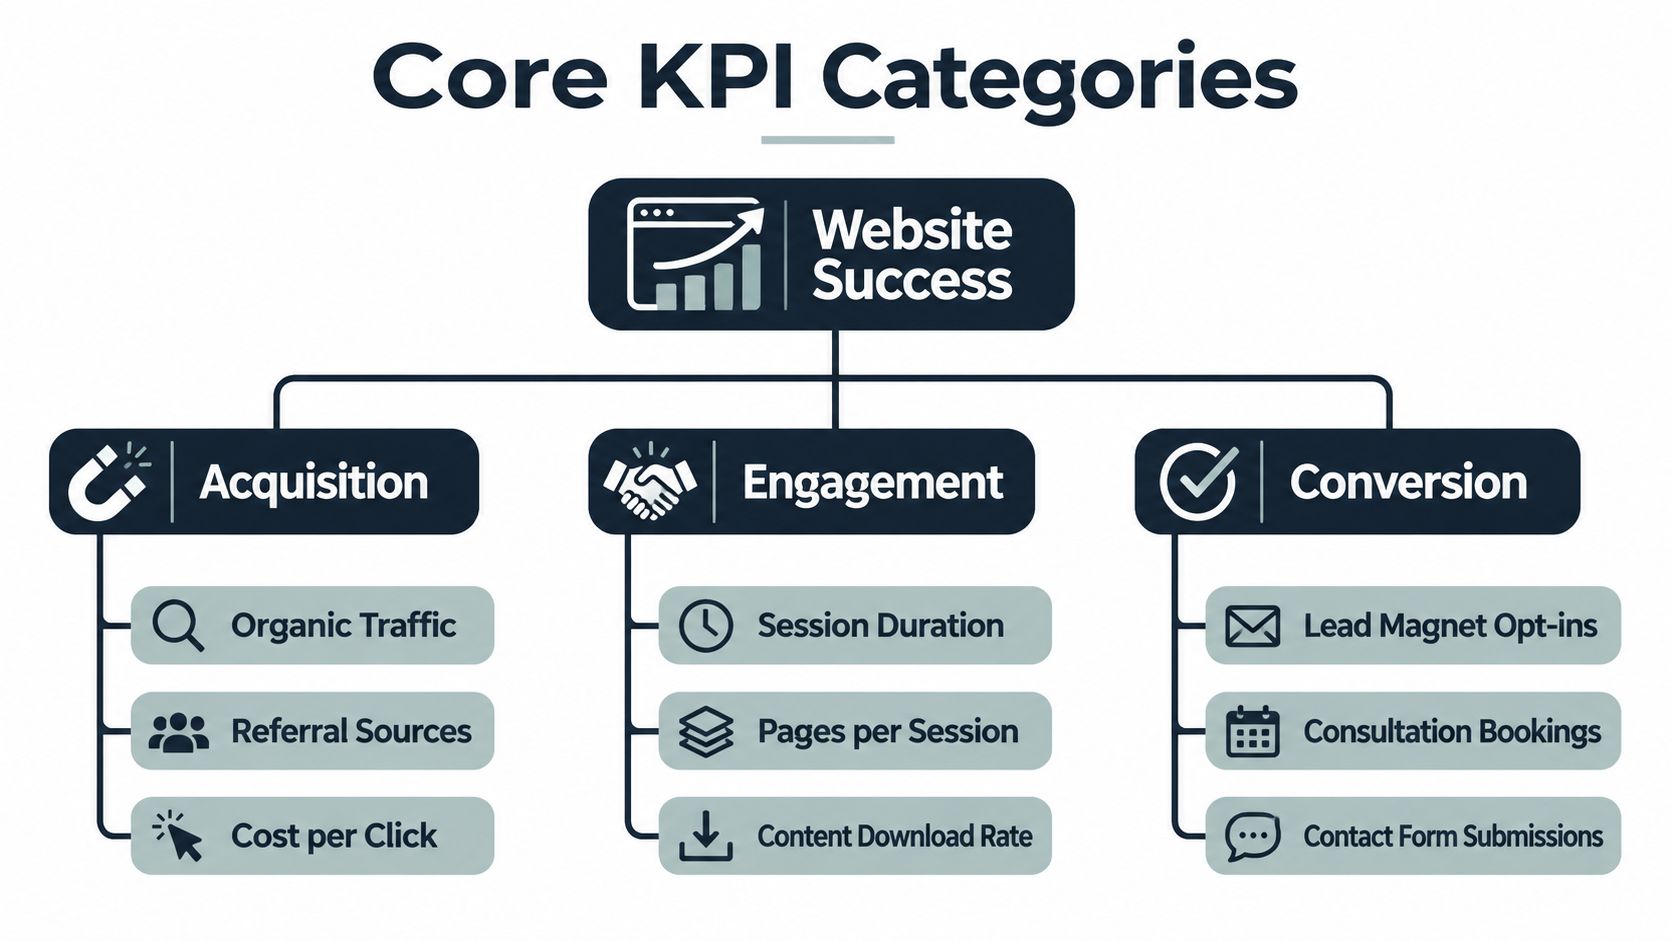
A financial advisory website needs a measurement model that follows the prospect's decision path. The foundational categories are acquisition, engagement, conversion, technical performance, and compliance. Each category answers a different operational question, and none should be interpreted in isolation.
Acquisition shows who is arriving
Acquisition KPIs identify the channels and campaigns sending visitors to the firm. Organic search, referrals, paid campaigns, email, and direct traffic should be separated because each source can bring a different level of intent.
The important distinction is qualified acquisition, not raw acquisition. A page attracting people searching for broad financial education may generate substantial readership but few suitable inquiries. A narrower page aligned with a firm's planning specialty may attract fewer visitors and produce stronger lead quality. Campaign tracking should preserve the source, landing page, service interest, and eventual disposition of the inquiry.
Engagement reveals consideration
Engagement measures whether visitors find enough relevance and clarity to continue. Page views count total page loads, while average session duration captures how long users remain in a session. These measures become more useful when paired with page type, device, source, return status, and next action.
An educational article shouldn't be judged by the same standard as a consultation page. A long article may succeed by answering a question and directing a returning visitor toward a service page. A service page should usually make the next action obvious, whether that's reviewing credentials, reading disclosures, or requesting a conversation.
Conversion records action
Conversion rate measures the percentage of visitors who complete a desired action. For advisory firms, macro-conversions can include consultation requests and appointment bookings. Micro-conversions can include a relevant guide download, a contact preference selection, or a request for more information.
Those events should be named and separated rather than combined into one inflated total. A guide download indicates interest, while a completed inquiry indicates a different level of intent. A financial services marketing agency guide can provide broader planning context, but the firm's own measurement model should reflect its specific audience and service process.
Technical and compliance categories protect the funnel
Technical KPIs measure whether visitors can use the website reliably. Core Web Vitals, form errors, scheduling failures, broken tracking events, and page availability belong in this layer. Compliance KPIs then test whether the conversion path captures required acknowledgments, disclosures, consent, and intake information without losing the audit trail.
A strong dashboard links the categories. It might show that a paid campaign produced qualified visits, that a service page held attention, that the form loaded correctly, and that completed inquiries moved into a compliant review process. That chain is more valuable than a standalone traffic total.
Engagement and Conversion Metrics That Actually Matter
Engagement metrics matter only when they clarify intent and lead quality. Average session duration can signal deeper consideration, but it does not show whether a visitor is suitable for the firm. General website sessions often last about 2 to 4 minutes, while evaluation-heavy B2B sites may reach 5 to 10 minutes. Treat those ranges as directional context, not targets detached from page purpose.
A visitor who spends several minutes reading a retirement planning article may still be gathering basic information. Another visitor may spend less time on a contact page because the form answered the immediate question and was completed quickly. The conversion event, service fit, and downstream outcome provide the context that duration lacks.
| Metric | RIA Firms | Wealth Management | Financial Planners | Context Notes |
|---|---|---|---|---|
| Session duration | Segment by page and intent | Compare research pages with service pages | Review alongside return visits | Benchmarks vary by site type |
| Engagement rate | Separate education from inquiry paths | Segment by source and device | Check whether key content leads to action | A high rate does not prove lead quality |
| Bounce rate | Interpret by landing-page purpose | Compare similar page types | Review with conversion events | GA4 defines bounce as the inverse of engagement rate |
| Consultation conversion | Track completed, qualified inquiries | Separate booking from general contact | Connect forms to CRM outcomes | Quality matters more than the blended rate |
| Content download rate | Track relevant resources | Identify topics that support consideration | Connect downloads to later inquiries | A download is a micro-conversion, not a client |
Read bounce rate with intent
There is no universal good bounce rate for advisory websites. Published ranges vary by site type, with ecommerce, B2B, and content sites showing different patterns. That variation is why an educational article should not be judged against a consultation landing page. The website analytics benchmark discussion offers broad context, but your own page purpose and lead outcomes should carry more weight.
Ask three questions before changing a page:
- What was the page's purpose? Was it meant to answer a question, build trust, explain a service, or collect an inquiry?
- Where did the visitor come from? Branded, referral, paid, and broad search visitors often behave differently.
- What happened afterward? Did the visitor return, view a service page, download a resource, submit a form, or enter a regulated intake process?
A high engagement rate can still produce weak prospects. A lower rate can accompany strong inquiries when the page gives qualified visitors a direct path to contact.
Track conversion quality, not just conversion rate
A low conversion rate may be healthy when the resulting inquiries fit the firm's geography, account minimums, and planning scope. A higher rate may waste follow-up time if the form attracts people the firm cannot serve. Each conversion event should therefore connect to a downstream field, such as qualification status, service fit, appointment completion, disclosure acknowledgment, or onboarding progression.
Use a reporting sequence that preserves this distinction:
- Measure engagement with relevant content. Track service-page views, resource interactions, return visits, and meaningful scroll depth.
- Separate micro-conversions from macro-conversions. Downloads, preference selections, and consultation requests represent different levels of intent.
- Connect forms to lead records. Preserve source, campaign, service interest, and required compliance information after submission.
- Review quality by segment. Compare channel, device, landing page, and service interest before changing the site.
- Audit the handoff. Confirm that qualified inquiries receive the expected review, disclosures, consent records, and onboarding follow-up.
The internal guide on conversion rate optimization for advisory websites supports this process by focusing attention on the path from relevant interest to a qualified conversation. A dashboard that stops at form submission hides whether marketing created a workable opportunity or merely another record for staff to screen.
Technical Performance KPIs and Core Web Vitals
A fast advisory website supports conversion and credibility at the same time. Slow pages can hide the firm's main message, delay form interaction, and make a prospective client question whether the online experience will match the firm's service standards. Core Web Vitals became part of standardized performance evaluation in May 2020, and began influencing mobile search rankings in June 2021, according to the Core Web Vitals benchmark history.
The three metrics identify different sources of friction:
- Largest Contentful Paint, or LCP, measures when the main above-the-fold content becomes visible. A good result is 2.5 seconds or less. Results from 2.5 to 4.0 seconds need improvement, and anything above 4.0 seconds is poor.
- Interaction to Next Paint, or INP, measures responsiveness after a visitor interacts with the page. The good threshold is 200 milliseconds or less. It matters on calculators, schedulers, and forms, where delayed feedback can leave visitors unsure whether an action worked.
- Cumulative Layout Shift, or CLS, measures unexpected movement of page elements. The good threshold is 0.1 or less. Stable layouts reduce the risk of a visitor clicking the wrong control after a disclosure, image, or widget loads.
| Metric | Good Threshold | Poor Threshold | Conversion Impact |
|---|---|---|---|
| LCP | 2.5 seconds or less | Over 4.0 seconds | Slow hero content can weaken first impressions and delay form visibility |
| INP | 200 milliseconds or less | Above the good threshold | Delayed validation or scheduler feedback can increase abandonment |
| CLS | 0.1 or less | Above the good threshold | Layout movement can cause errors and reduce confidence |
Prioritize fixes by conversion risk
Advisory websites commonly combine large hero images, embedded video, tracking scripts, scheduling widgets, and compliance content. These assets can compete with the message and controls a prospective client needs to understand the firm and begin a regulated inquiry.
A practical technical audit should examine:
- Above-the-fold content: Compress the primary image and remove unnecessary render-blocking assets.
- Interactive forms: Test validation, field focus, error messages, and confirmation behavior on actual devices.
- Scheduling components: Check whether embedded calendars delay the page or fail to communicate errors.
- Layout stability: Reserve space for images, disclosures, and widgets before they load.
- Measurement reliability: Confirm that form starts, errors, submissions, confirmations, and consent records are captured consistently.
Technical scores should sit beside lead-quality measures, not replace them. A faster form is useful only if it continues to collect the information required for qualification, review, and compliant follow-up.
A published case study documented up to a 61.13% increase in conversion rate associated with a good LCP score, as reported in Google's Rakuten case study. That result does not predict the outcome for an advisory firm, but it demonstrates why page performance deserves attention alongside qualified inquiries and completed onboarding steps.
A 2026 performance analysis reported that 55.7% of web origins globally passed all three Core Web Vitals thresholds in January 2026, up from roughly 50% in early 2024, based on the published benchmark data. Passing is not universal. Review mobile and desktop performance separately, then connect technical problems to the pages, forms, and regulated actions where prospects are most likely to continue or abandon.
Device-Specific Benchmarks for Financial Services
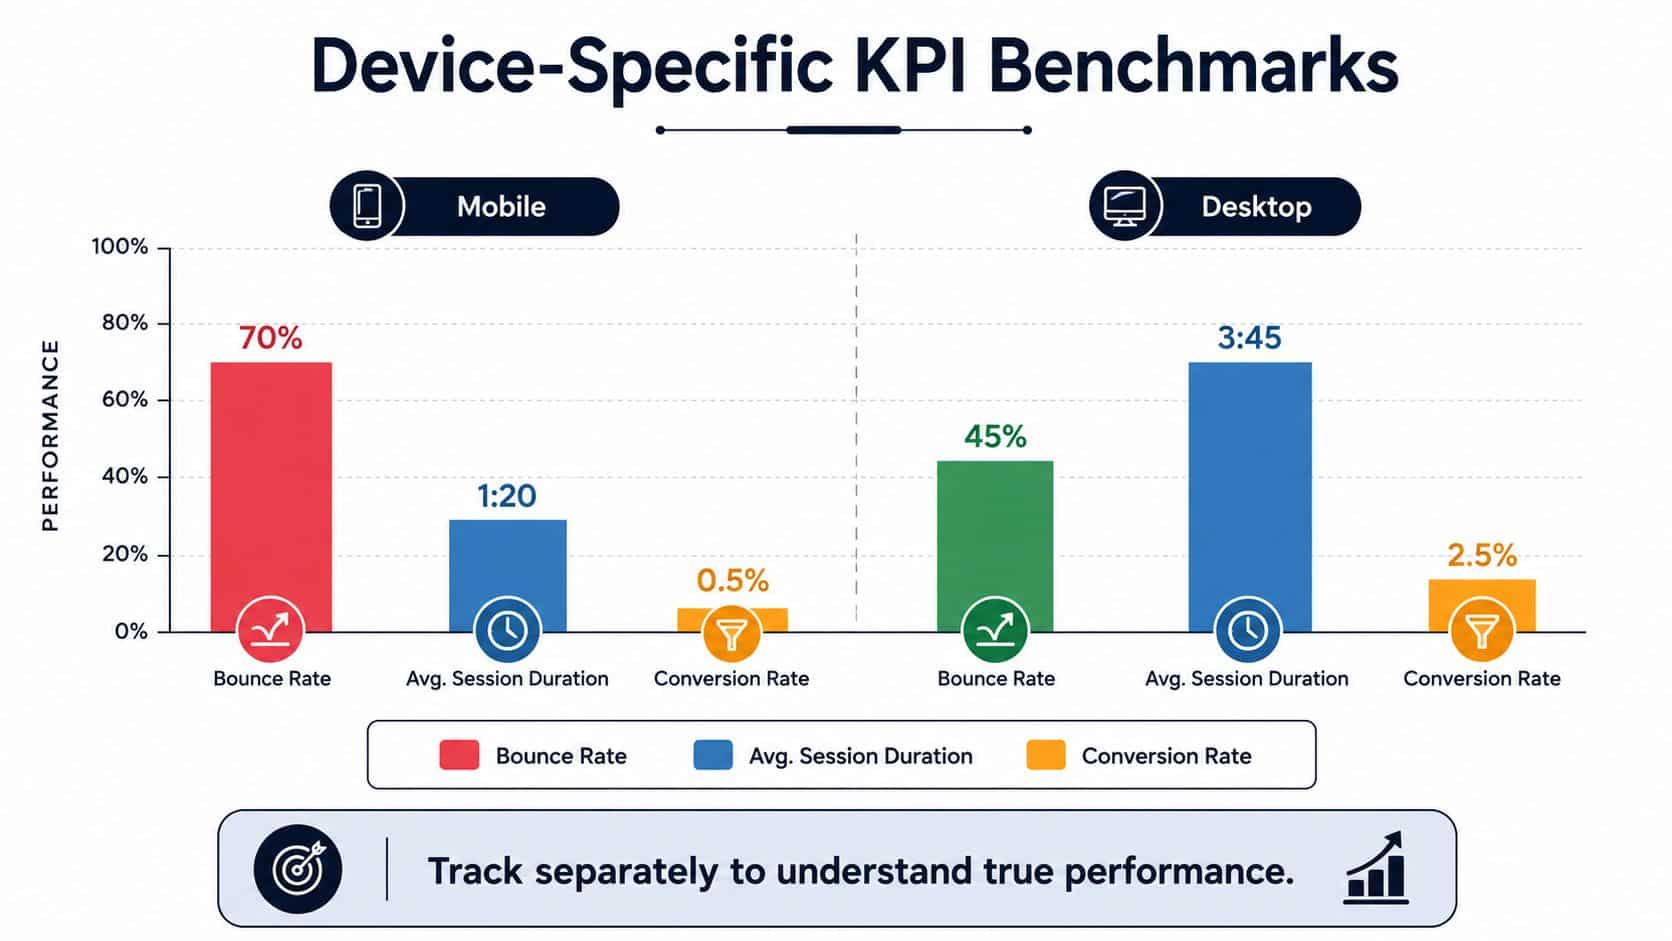
A blended device report can conceal the friction that blocks a qualified prospect. Mobile visitors often discover an advisory firm, review credentials, or save an educational page before returning on desktop to complete a form. Desktop visitors may be more prepared to schedule a consultation, but that behavior should be verified against lead quality and regulated onboarding outcomes.
Segment the journey before judging performance
Separate device reporting into four questions:
- Acquisition quality: Which channels bring mobile and desktop visitors, and do those visitors fit the firm's intended audience?
- Engagement depth: Which device reaches service details, advisor credentials, disclosures, and educational resources?
- Conversion behavior: Which device starts, completes, or abandons an inquiry, consultation request, or onboarding step?
- Technical experience: Does each device category support readable pages, usable navigation, and reliable access to required disclosures?
Global performance benchmarks can provide context, but they should not replace the firm's own evidence. Review GA4 and Search Console device breakdowns, then compare those findings with qualified inquiry rates, consent capture, appointment completion, and progression into regulated follow-up. A high mobile conversion rate may still be weak if submissions lack the information needed for review. A lower desktop conversion rate may be acceptable if its completed inquiries are better qualified.
Match the KPI to the device role
Mobile KPIs should show whether the site builds enough trust for a later return. Track service-page engagement, advisor credential views, resource consumption, tap-to-call activity, return visits, and form starts. Desktop reporting should give more weight to completed forms, appointment actions, detailed service content, disclosure views, and the quality of the resulting inquiry.
A mobile form can demand too much scrolling, make thumb entry difficult, or place the primary action beneath distracting content. A desktop page can offer ample space yet present credentials, disclosures, qualification questions, and the next step in an unclear order. Review both paths with actual device sessions and connect each failure to its effect on qualified lead handling.
A device-specific dashboard should show where each device contributes to the relationship. It does not require every conversion to happen on the first device.
Compare device cohorts over the same period and with consistent source filters. A mobile visitor arriving through an educational query should not be judged against a desktop visitor from a branded campaign. The useful view joins device, source, landing page, return status, form behavior, consent capture, and eventual lead quality. That connection keeps device reporting tied to compliant growth rather than vanity traffic totals.
Building Your KPI Dashboard and Reporting Cadence
A dashboard with fifty metrics can create the appearance of control while preventing action. Financial advisory firms need a smaller operating view with clear ownership, consistent definitions, and a reporting rhythm that matches how decisions are made.
Build three reporting layers
Executive summary: Partners and firm leaders need qualified inquiries, completed consultations, source quality, onboarding progression, and major risks. This view should answer whether the website is supporting business development.
Operational review: Marketing and growth staff need landing-page conversion, content engagement, campaign source, device performance, form starts, and appointment completion. These metrics support monthly decisions about pages, messaging, and allocation.
Diagnostic monitoring: Technical and operations owners need broken events, form errors, page availability, tracking anomalies, and Core Web Vitals. These indicators help teams find measurement or usability failures before they distort the main report.
A one-page monthly report can use five blocks:
- Acquisition: Qualified sessions by source and campaign.
- Engagement: Key service-page activity, return visits, and content progression.
- Conversion: Form starts, completed inquiries, appointments, and qualification status.
- Reliability: Form errors, tracking gaps, and performance exceptions.
- Decision log: The action, owner, expected result, and review date.
Use a cadence that supports decisions
Weekly reporting should focus on exceptions, not routine traffic recaps. A sudden loss of form submissions, a campaign mismatch, or a tracking break deserves attention. Stable page views rarely require a weekly partner meeting.
Monthly reviews should assess lead quality, source performance, content contribution, device differences, and funnel abandonment. Quarterly analysis should connect website outcomes with pipeline development, client acquisition costs, positioning, and strategic priorities.
The technical setup needs consistent event naming and documented definitions. Firms can review how to add a site to Google Analytics as part of implementation, then configure events for form starts, completed submissions, appointment actions, resource downloads, disclosure acknowledgments, and errors.
Advisor Momentum offers financial-professional websites with conversion tracking and lead form analytics, which can support this kind of reporting when the implementation preserves compliance review and downstream lead information. The important point is not the platform choice. It is whether the dashboard connects website activity to qualified outcomes without collecting unnecessary personal information.
The Compliance-Aware KPI Framework for Regulated Firms
A standard website dashboard stops at the form submission. A compliance-aware framework asks what happened before and after that event, and whether the firm can verify the path.
The core measure should be qualified, compliant lead progression, not raw lead volume. That requires clear definitions for an acceptable inquiry, a completed intake, a required acknowledgment, a delivered disclosure, and a handoff to the appropriate team.
| Standard KPI | Compliance-Aware KPI | Why It Matters |
|---|---|---|
| Traffic volume | Qualified traffic by source and audience fit | Shows whether acquisition reaches the intended market |
| Form submissions | Accurate, complete, reviewable inquiries | Separates usable opportunities from incomplete records |
| Conversion rate | Compliance-ready conversion rate | Measures progress through the regulated path |
| Download rate | Relevant resource engagement followed by permissioned follow-up | Connects education with an appropriate next action |
| Appointment bookings | Completed and properly documented appointments | Avoids treating abandoned or unsuitable bookings as wins |
| Consent rate | Consent capture tied to the relevant disclosure | Supports responsible data collection |
| Lead count | Qualified leads that complete required intake steps | Connects marketing activity with operational readiness |
| Tracking coverage | Complete, reviewable interaction records | Helps identify gaps that can distort reporting |
Measure the friction that revenue reports miss
Firms should monitor form accuracy, disclosure acknowledgment, consent capture, delivery confirmations, questionnaire completion, and abandonment at each regulated intake step. They should also check whether event records preserve enough context for internal review without exposing more personal information than necessary.
Tracking anomalies deserve executive attention. A broken event can make a campaign look unproductive, while an incorrectly configured event can make weak traffic appear successful. Reliability is therefore a business KPI, not merely a technical maintenance task.
The most useful paid acquisition metric is the cost of a compliance-ready qualified lead, rather than the cost of a click or raw form fill. That measure encourages marketing, operations, and compliance teams to optimize the full path together. It also exposes where a seemingly successful campaign creates work without producing suitable opportunities.
Measurement standard: If a metric can't be traced to a business decision, a user experience issue, or a compliance obligation, it probably doesn't belong in the primary report.
Advisor Momentum can help firms connect compliance-aware website design, lead form analytics, search visibility, and conversion reporting within a financial-services marketing process. Visit Advisor Momentum to discuss a website measurement framework that prioritizes qualified prospects, reliable tracking, and compliant onboarding rather than vanity traffic totals.
